
by Pat Ferris
In response to interest expressed to me after the 2004 annual general meeting, I put together this article regarding the Lake Partner Program. This article will discuss what the Lake Partner Program is, give reasons for its importance, suggest preventive measures, show how our lake compares with others, and indicate future initiatives.
THE PROGRAM
The Ministry of the Environment ![]() (MOE) initiated the Lake Partner Program in an effort to amass a database of nutrient related information for our lakes. The program encourages volunteers to get involved by taking water clarity readings and obtaining samples for total phosphorous analysis. Please see the Lake Partner Program for more information.
(MOE) initiated the Lake Partner Program in an effort to amass a database of nutrient related information for our lakes. The program encourages volunteers to get involved by taking water clarity readings and obtaining samples for total phosphorous analysis. Please see the Lake Partner Program for more information.
THE IMPORTANCE
Water clarity and total phosphorous (TP) are two of the primary factors affecting the level of algae in a lake. In general, the clarity of a lake tells us how deep the sunlight penetrates. Algae will only grow in areas that have adequate sunlight. Total phosphorous is a nutrient used by algae during their life cycles and as such gives an indication of the potential for algae to exist.
Algae represent the base of the food chain and an important source of dissolved oxygen. If there are too few algae, the level of aquatic life in a lake will be very low. The lakes in Killarney Provincial Park are an example of low algae levels where many of the lakes are clear and have a bluish hue. The relatively high acid level in such lakes prevents the growth of algae, denying aquatic life of a food source. On the other hand, lakes that are very high in algae suffer wide fluctuations of the dissolved oxygen level, playing havoc with the life cycles of other aquatic species. High algae levels also have a negative impact on intake pipes, boats, and general aesthetics.
Algae liberate oxygen and consume carbon dioxide via photosynthesis. An important thing to keep in mind is that algae must respire as well; this process consumes oxygen and liberates carbon dioxide. Algae respire constantly while they photosynthesize, but only if in contact with sunlight.
Our lake currently has a good balance in terms of algae levels. Some ways that we can ensure a continued equilibrium are as follows:
- installing and maintaining approved septic systems
- limiting shore-line development
- using soaps and detergents that do not contain phosphates
THE STATISTICS
The figure below is a histogram showing the distribution of total phosphorous concentrations in Ontario lakes. I placed a diagram representing total phosphorous statistics obtained from data pertaining to our lake on the figure for comparison purposes. As of 2003, we had 18 total phosphorous results; we generated the statistics for the WWK DATA diagram from these data.
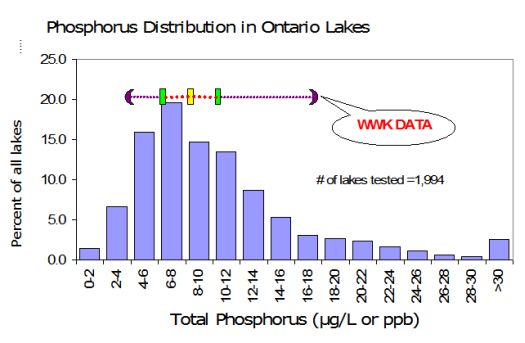
Figure 1. Phosphorous levels in Ontario lakes
Looking at the blue bars on the histogram we can see that almost 20% of all the Ontario lakes tested had total phosphorous concentrations between 6 and 8 parts per billion (ppb) or micrograms per liter (µg/L). The multi-colored plot labeled WWK DATA above the blue bars represents data for our lake. The position of the WWK DATA plot on the y-axis (percent of all lakes tested) is immaterial; what is important is its relation to the x-axis (total phosphorous). The purple brackets indicate the minimum and maximum values obtained in our waters. The green vertical bars, from left to right, represent the first and third quartiles respectively while the vertical yellow bar represents the mean.
Fifteen percent of the other lakes tested in this program share our average total phosphorous concentration (8 to 10 ppb). If we expand our perspective to include the first and third quartiles in our comparison, we see that half of all of the total phosphorous results from our lake are the same as about half (48%) of all of the total phosphorous results from other Ontario lakes (6 to 12 ppb). One interpretation of this information is that our lake is very similar with respect to total phosphorous as other tested lakes (6 to 12 ppb), and that our volunteers' samples are comparable to samples from other volunteers in Ontario. Good work!
Another interesting bit of information that the histogram provides (and the data for our lake reflects) is that there are some questionably high total phosphorous results. Ideally, with such a large number of samples analyzed, the histogram should be symmetrical about the mean. The MOE noticed this idiosyncrasy, and suggested that the higher results were due to large amounts of zooplankton contaminating the samples. Zooplankton contain relatively large amounts of phosphorous in a bound form (i.e., it is not immediately available to be used as nutrients for algae), and the bound phosphorous should not be considered when we are trying to determine the current potential for algal growth. This seems to suggest that we are actually analyzing for total available or free phosphorous rather than total phosphorous but I will avoid getting into semantics!
top ↑
THE FUTURE
To correct the bias, the MOE included filters with the sampling kits. The filters prevent large zooplankton from getting into the sample containers. In 2004, we used the new filters, and we can reasonably expect to see data that are more symmetrical in the future. The preventive measures mentioned in this article along with continued monitoring of pertinent information are the best tools that we have in ensuring that our lake retains many of the characteristics that we have come to love.
If this article generated any questions, or if you are interested in volunteering for the sampling program, please contact me via e-mail: patferris@rogers.com